Archivero is in early access — your sources, PDFs and citations in one library.Request early access →
Archivero/guides/
APAMLAHarvardThesis writing
Subscribe
Archivero/guides/Request early access →

Guides

APA styleMLA styleHarvard referencingThesis writing

Compare

APA 6th vs 7thMLA 8th vs 9thHarvard vs APAThesis vs dissertation

Product

FeaturesEarly access

Resources

DocsCheat sheetsNewsletter

Company

ContactStatus ↗
© 2025–2026 Ernesto F. GonzálezGuidesDocsContactPrivacyTerms
Guides/Citations/Harvard Referencing Style

Harvard Tables and Figures

How to label, number, and reference tables and figures in a Harvard-style paper, with annotated examples.

7 min readHarvard

Key Takeaways

  • Tables present data in rows and columns. Figures cover all other visual elements — charts, graphs, images, diagrams, maps.
  • Number tables and figures sequentially and separately: Table 1, Table 2… and Figure 1, Figure 2…
  • Place the table number and title above the table; place the figure number and caption below the figure.
  • Refer to every table and figure by number in the body text:
    • As shown in Table 3, the dropout rate increased between 2018 and 2022.
  • When reproducing or adapting a visual from another source, include a source note beneath the table or figure:
    • Source: Adapted from Taylor (2021, p. 45).
  • The original source must also appear in the reference list as a standard entry.
  • Use sentence case for table titles and figure captions, consistent with Harvard conventions.
  • Check your institution's guide — some universities place all tables and figures in an appendix rather than within the text.

On this page

1 of 22
Key TakeawaysTables vs. Figures — When to Use WhichTable FormattingNumber and TitleSource NoteExample: Table With a SourceFigure FormattingNumber and CaptionSource NoteExample: Figure From Your Own DataPlacement — In-Text vs. AppendixReferencing Tables and Figures in the Body TextCiting the Original SourceReproduced vs. AdaptedReference List EntryExamples for Different Visual TypesChart or GraphPhotographDiagram or FlowchartData Table From a Government SourceCommon Mistakes With Tables and FiguresWhat's Next?
All Harvard guides →

Tables and figures in Harvard referencing are numbered sequentially, given a descriptive title or caption, and cited in the body text by their number. Tables present data in rows and columns; figures include everything else — charts, graphs, diagrams, photographs, maps, and illustrations. When a table or figure is reproduced or adapted from another source, the original must be credited in both the caption and the reference list.

Tables vs. Figures — When to Use Which

The distinction is straightforward:

ElementUsed ForExamples
TableUsed ForStructured data in rows and columnsExamplesSurvey results, statistical comparisons, demographic breakdowns
FigureUsed ForAny visual that is not a tableExamplesBar charts, pie charts, photographs, flowcharts, maps, diagrams

If your data can be read efficiently in a grid, use a table. If a visual representation adds clarity or impact, use a figure. Avoid duplicating the same data in both a table and a figure — choose the format that communicates most effectively.

Table Formatting

Number and Title

Place the table number and title above the table, on separate lines or on the same line depending on your institution's guide. Use bold for the table number:

Table 1Dropout rates by region, 2018–2022

Or:

Table 1:Dropout rates by region, 2018–2022

Use sentence case for the title — capitalise only the first word and proper nouns.

Source Note

If the data comes from another source, add a source note below the table. The note should include enough detail to match the reference list entry:

Source: Adapted from Office for National Statistics (2023, p. 12).

If you created the table yourself from your own data, no source note is needed.

Example: Table With a Source

Table 2: Mean satisfaction scores by department

Department202120222023
Marketing20214.220224.520234.3
Engineering20213.820224.020234.1
Human Resources20214.620224.420234.7

Source: Reproduced from Chen and Okafor (2024, p. 88).

In the body text, refer to it by number:

As Table 2 shows, Human Resources consistently recorded the highest satisfaction scores across the three-year period (Chen and Okafor, 2024).

Figure Formatting

Number and Caption

Place the figure number and caption below the figure. Use bold for the figure number:

Figure 1:Distribution of responses by age group (n = 1,240).

Or, if your institution prefers a separate line:

Figure 1Distribution of responses by age group (n = 1,240).

Source Note

As with tables, add a source note if the figure is reproduced or adapted from another work. Place it immediately after the caption:

Figure 2:Annual CO₂ emissions by sector, 2010–2023. Source: Adapted from Department for Environment, Food and Rural Affairs (2024, p. 34).

Example: Figure From Your Own Data

If you created the figure from your own research, you still need a number and caption — but no source note:

Figure 3:Participant responses to the question "How confident are you in your referencing skills?" (n = 312).

Placement — In-Text vs. Appendix

There are two common approaches:

  1. Embedded in the text — place the table or figure as close as possible to where it is first mentioned. This is the default for most assignments.
  2. Appendix — some institutions or disciplines require all tables and figures to appear in an appendix at the end of the paper, with cross-references in the body text.

Check your module handbook or institution's Harvard guide. If tables and figures go in an appendix, label them with the appendix letter:

See Table A1 in Appendix A.

Referencing Tables and Figures in the Body Text

Every table and figure must be mentioned at least once in the text. Refer to them by number, not by vague phrases like "the table below" or "the following chart":

Do ThisNot This
As shown in Table 1…As shown in the table below…
Figure 3 illustrates…The following figure illustrates…
The data in Table 2 suggest…The data in this table suggest…

This keeps references unambiguous — especially when the document is reformatted and the table or figure shifts position.

When introducing a table or figure, briefly explain what the reader should notice:

Figure 4 shows that respondents aged 18–24 were significantly more likely to report anxiety symptoms than those aged 45–54.

Avoid simply restating every data point — the table or figure already does that. Instead, highlight the key trend, comparison, or finding.

Citing the Original Source

When a table or figure is reproduced or adapted from a published source, you must credit the original in two places:

  1. Source note beneath the table or figure (as shown above)
  2. Reference list — a full Harvard entry for the original source

Reproduced vs. Adapted

TermMeaningSource Note Wording
ReproducedMeaningCopied exactly as it appears in the originalSource Note WordingSource: Reproduced from Author (Year, p. X).
AdaptedMeaningModified from the original (e.g., columns removed, data recalculated)Source Note WordingSource: Adapted from Author (Year, p. X).

If you created the table or figure yourself — even using published data — use "Data from" rather than "Reproduced from":

Source: Data from World Bank (2024).

Reference List Entry

The reference list entry follows the standard Harvard format for whatever the original source is — book, journal article, report, website, etc. No special formatting is needed for the fact that it was used as the source of a table or figure.

Chen, L. and Okafor, D. (2024) 'Employee satisfaction trends in UK technology firms', Journal of Organisational Behaviour, 39(2), pp. 80–96. doi:10.1234/job.2024.0039.

Examples for Different Visual Types

Chart or Graph

Figure 5:Revenue growth by quarter, 2022–2024. Source: Adapted from Patel (2024, p. 67).

In-text: Figure 5 reveals a consistent upward trend in revenue across all four quarters of 2023 (Patel, 2024).

Photograph

Figure 6:The exterior of the Bauhaus building in Dessau, Germany. Source: Photograph by Müller (2019).

In-text: The Bauhaus building's glass curtain wall (Figure 6) exemplifies the movement's emphasis on functional materials (Müller, 2019).

Diagram or Flowchart

Figure 7:Decision-making process for ethical review applications. Source: Reproduced from University of Edinburgh (2023, p. 5).

In-text: The ethical review process (Figure 7) includes three decision points at which an application may be referred back to the researcher (University of Edinburgh, 2023).

Data Table From a Government Source

Table 3:UK unemployment rates by region, January 2024. Source: Data from Office for National Statistics (2024).

In-text: Table 3 shows that the North East had the highest unemployment rate at 5.2% in January 2024 (Office for National Statistics, 2024).

Common Mistakes With Tables and Figures

MistakeWhy It's WrongCorrect Approach
No number or title/captionWhy It's WrongThe reader can't refer to the visual by nameCorrect ApproachAlways number tables and figures sequentially and include a descriptive title or caption
Placing the caption above a figureWhy It's WrongHarvard convention puts figure captions below, table titles aboveCorrect ApproachTable title above; figure caption below
Saying "see below" or "the following table"Why It's WrongPositions may shift during formattingCorrect ApproachRefer to tables and figures by number
Missing source note for reproduced materialWhy It's WrongFailing to credit the original is plagiarismCorrect ApproachAdd a source note and a reference list entry
Duplicating data in both a table and a figureWhy It's WrongRedundant and wastes the reader's timeCorrect ApproachChoose the clearest format for the data
Using "Table" and "Figure" numbering interchangeablyWhy It's WrongTables and figures are numbered in separate sequencesCorrect ApproachTable 1, Table 2… and Figure 1, Figure 2… are independent

What's Next?

Now that you know how to format tables and figures, explore these related guides:

  • Harvard Referencing Example Paper — see tables and figures in context in a fully annotated sample paper
  • Harvard Format Paper — page layout, margins, headings, and overall paper formatting
  • Harvard Reference List — how to format the reference list entries for your table and figure sources
All Harvard guides →
← PreviousHow to Reference Social Media in Harvard StyleNext →How to Cite a Secondary Source in Harvard

More on Harvard referencing

The dominant system in British, Australian and international universities. In-text citations, reference lists and the local conventions that vary by department.

View all 26 guides →
8 sections·6 min readHarvardHow to Cite a Secondary Source in Harvard10 sections·6 min readHarvardHow to Cite a Source With No Date in Harvard10 sections·6 min readHarvardHow to Reference a Lecture in Harvard Style11 sections·6 min readHarvardHow to Reference a Government Report in Harvard Style

Your sources, PDFs and citations in one library

  • Import a Zotero, Mendeley or EndNote library — or a folder of PDFs
  • Highlight and annotate without leaving the source
  • Cite in any CSL style as you write, with one shared library for your lab
Request early accessSee the product →
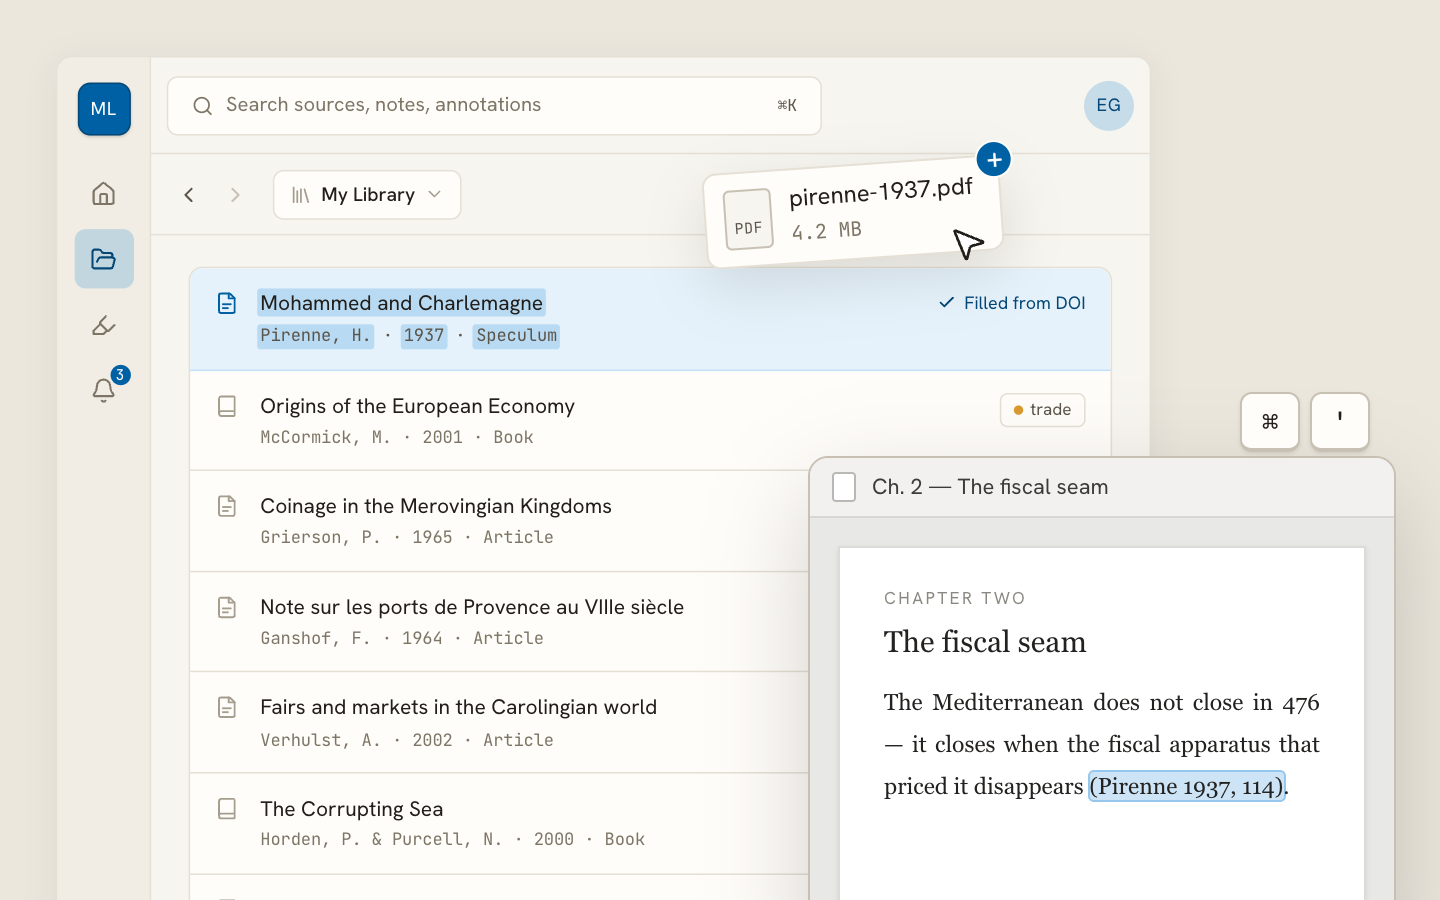
Archivero library view with a source list and an open PDF

Your weekly research workflow, in one email

One tested workflow, three links, no filler — every Tuesday.

Unsubscribe in one click. We never share your address.

Guides/Citations/Harvard Referencing Style

Harvard Tables and Figures

How to label, number, and reference tables and figures in a Harvard-style paper, with annotated examples.

7 min readHarvard

Key Takeaways

  • Tables present data in rows and columns. Figures cover all other visual elements — charts, graphs, images, diagrams, maps.
  • Number tables and figures sequentially and separately: Table 1, Table 2… and Figure 1, Figure 2…
  • Place the table number and title above the table; place the figure number and caption below the figure.
  • Refer to every table and figure by number in the body text:
    • As shown in Table 3, the dropout rate increased between 2018 and 2022.
  • When reproducing or adapting a visual from another source, include a source note beneath the table or figure:
    • Source: Adapted from Taylor (2021, p. 45).
  • The original source must also appear in the reference list as a standard entry.
  • Use sentence case for table titles and figure captions, consistent with Harvard conventions.
  • Check your institution's guide — some universities place all tables and figures in an appendix rather than within the text.

On this page

1 of 22
Key TakeawaysTables vs. Figures — When to Use WhichTable FormattingNumber and TitleSource NoteExample: Table With a SourceFigure FormattingNumber and CaptionSource NoteExample: Figure From Your Own DataPlacement — In-Text vs. AppendixReferencing Tables and Figures in the Body TextCiting the Original SourceReproduced vs. AdaptedReference List EntryExamples for Different Visual TypesChart or GraphPhotographDiagram or FlowchartData Table From a Government SourceCommon Mistakes With Tables and FiguresWhat's Next?
All Harvard guides →

Tables and figures in Harvard referencing are numbered sequentially, given a descriptive title or caption, and cited in the body text by their number. Tables present data in rows and columns; figures include everything else — charts, graphs, diagrams, photographs, maps, and illustrations. When a table or figure is reproduced or adapted from another source, the original must be credited in both the caption and the reference list.

Tables vs. Figures — When to Use Which

The distinction is straightforward:

ElementUsed ForExamples
TableUsed ForStructured data in rows and columnsExamplesSurvey results, statistical comparisons, demographic breakdowns
FigureUsed ForAny visual that is not a tableExamplesBar charts, pie charts, photographs, flowcharts, maps, diagrams

If your data can be read efficiently in a grid, use a table. If a visual representation adds clarity or impact, use a figure. Avoid duplicating the same data in both a table and a figure — choose the format that communicates most effectively.

Table Formatting

Number and Title

Place the table number and title above the table, on separate lines or on the same line depending on your institution's guide. Use bold for the table number:

Table 1Dropout rates by region, 2018–2022

Or:

Table 1:Dropout rates by region, 2018–2022

Use sentence case for the title — capitalise only the first word and proper nouns.

Source Note

If the data comes from another source, add a source note below the table. The note should include enough detail to match the reference list entry:

Source: Adapted from Office for National Statistics (2023, p. 12).

If you created the table yourself from your own data, no source note is needed.

Example: Table With a Source

Table 2: Mean satisfaction scores by department

Department202120222023
Marketing20214.220224.520234.3
Engineering20213.820224.020234.1
Human Resources20214.620224.420234.7

Source: Reproduced from Chen and Okafor (2024, p. 88).

In the body text, refer to it by number:

As Table 2 shows, Human Resources consistently recorded the highest satisfaction scores across the three-year period (Chen and Okafor, 2024).

Figure Formatting

Number and Caption

Place the figure number and caption below the figure. Use bold for the figure number:

Figure 1:Distribution of responses by age group (n = 1,240).

Or, if your institution prefers a separate line:

Figure 1Distribution of responses by age group (n = 1,240).

Source Note

As with tables, add a source note if the figure is reproduced or adapted from another work. Place it immediately after the caption:

Figure 2:Annual CO₂ emissions by sector, 2010–2023. Source: Adapted from Department for Environment, Food and Rural Affairs (2024, p. 34).

Example: Figure From Your Own Data

If you created the figure from your own research, you still need a number and caption — but no source note:

Figure 3:Participant responses to the question "How confident are you in your referencing skills?" (n = 312).

Placement — In-Text vs. Appendix

There are two common approaches:

  1. Embedded in the text — place the table or figure as close as possible to where it is first mentioned. This is the default for most assignments.
  2. Appendix — some institutions or disciplines require all tables and figures to appear in an appendix at the end of the paper, with cross-references in the body text.

Check your module handbook or institution's Harvard guide. If tables and figures go in an appendix, label them with the appendix letter:

See Table A1 in Appendix A.

Referencing Tables and Figures in the Body Text

Every table and figure must be mentioned at least once in the text. Refer to them by number, not by vague phrases like "the table below" or "the following chart":

Do ThisNot This
As shown in Table 1…As shown in the table below…
Figure 3 illustrates…The following figure illustrates…
The data in Table 2 suggest…The data in this table suggest…

This keeps references unambiguous — especially when the document is reformatted and the table or figure shifts position.

When introducing a table or figure, briefly explain what the reader should notice:

Figure 4 shows that respondents aged 18–24 were significantly more likely to report anxiety symptoms than those aged 45–54.

Avoid simply restating every data point — the table or figure already does that. Instead, highlight the key trend, comparison, or finding.

Citing the Original Source

When a table or figure is reproduced or adapted from a published source, you must credit the original in two places:

  1. Source note beneath the table or figure (as shown above)
  2. Reference list — a full Harvard entry for the original source

Reproduced vs. Adapted

TermMeaningSource Note Wording
ReproducedMeaningCopied exactly as it appears in the originalSource Note WordingSource: Reproduced from Author (Year, p. X).
AdaptedMeaningModified from the original (e.g., columns removed, data recalculated)Source Note WordingSource: Adapted from Author (Year, p. X).

If you created the table or figure yourself — even using published data — use "Data from" rather than "Reproduced from":

Source: Data from World Bank (2024).

Reference List Entry

The reference list entry follows the standard Harvard format for whatever the original source is — book, journal article, report, website, etc. No special formatting is needed for the fact that it was used as the source of a table or figure.

Chen, L. and Okafor, D. (2024) 'Employee satisfaction trends in UK technology firms', Journal of Organisational Behaviour, 39(2), pp. 80–96. doi:10.1234/job.2024.0039.

Examples for Different Visual Types

Chart or Graph

Figure 5:Revenue growth by quarter, 2022–2024. Source: Adapted from Patel (2024, p. 67).

In-text: Figure 5 reveals a consistent upward trend in revenue across all four quarters of 2023 (Patel, 2024).

Photograph

Figure 6:The exterior of the Bauhaus building in Dessau, Germany. Source: Photograph by Müller (2019).

In-text: The Bauhaus building's glass curtain wall (Figure 6) exemplifies the movement's emphasis on functional materials (Müller, 2019).

Diagram or Flowchart

Figure 7:Decision-making process for ethical review applications. Source: Reproduced from University of Edinburgh (2023, p. 5).

In-text: The ethical review process (Figure 7) includes three decision points at which an application may be referred back to the researcher (University of Edinburgh, 2023).

Data Table From a Government Source

Table 3:UK unemployment rates by region, January 2024. Source: Data from Office for National Statistics (2024).

In-text: Table 3 shows that the North East had the highest unemployment rate at 5.2% in January 2024 (Office for National Statistics, 2024).

Common Mistakes With Tables and Figures

MistakeWhy It's WrongCorrect Approach
No number or title/captionWhy It's WrongThe reader can't refer to the visual by nameCorrect ApproachAlways number tables and figures sequentially and include a descriptive title or caption
Placing the caption above a figureWhy It's WrongHarvard convention puts figure captions below, table titles aboveCorrect ApproachTable title above; figure caption below
Saying "see below" or "the following table"Why It's WrongPositions may shift during formattingCorrect ApproachRefer to tables and figures by number
Missing source note for reproduced materialWhy It's WrongFailing to credit the original is plagiarismCorrect ApproachAdd a source note and a reference list entry
Duplicating data in both a table and a figureWhy It's WrongRedundant and wastes the reader's timeCorrect ApproachChoose the clearest format for the data
Using "Table" and "Figure" numbering interchangeablyWhy It's WrongTables and figures are numbered in separate sequencesCorrect ApproachTable 1, Table 2… and Figure 1, Figure 2… are independent

What's Next?

Now that you know how to format tables and figures, explore these related guides:

  • Harvard Referencing Example Paper — see tables and figures in context in a fully annotated sample paper
  • Harvard Format Paper — page layout, margins, headings, and overall paper formatting
  • Harvard Reference List — how to format the reference list entries for your table and figure sources
All Harvard guides →
← PreviousHow to Reference Social Media in Harvard StyleNext →How to Cite a Secondary Source in Harvard

More on Harvard referencing

The dominant system in British, Australian and international universities. In-text citations, reference lists and the local conventions that vary by department.

View all 26 guides →
8 sections·6 min readHarvardHow to Cite a Secondary Source in Harvard10 sections·6 min readHarvardHow to Cite a Source With No Date in Harvard10 sections·6 min readHarvardHow to Reference a Lecture in Harvard Style11 sections·6 min readHarvardHow to Reference a Government Report in Harvard Style

Your sources, PDFs and citations in one library

  • Import a Zotero, Mendeley or EndNote library — or a folder of PDFs
  • Highlight and annotate without leaving the source
  • Cite in any CSL style as you write, with one shared library for your lab
Request early accessSee the product →
Archivero library view with a source list and an open PDF

Your weekly research workflow, in one email

One tested workflow, three links, no filler — every Tuesday.

Unsubscribe in one click. We never share your address.